UCLA Transfers
By The Numbers (Fall 2022 Data)...
General Overview
- Total Transfer Population: 7,700+ (23.9% of the undergraduate population)
- In 2022, UCLA received 24,930 applicants and admitted 5,961 students (24% acceptance rate)
- Transfers make up 36% of the total undergraduate population
- 43% of transfers (domestic) are first-generation college students
Median GPA for Admitted Transfers: 3.92
Where are students transferring from?
- 93% come from CA Community Colleges
- 4% from other UC Campuses / 1% from a CSU
- 2% from other schools
Graduation Rate (2019 Data)
- 75.4% Graduate within 2 years or less
- 91.3% Graduate within 3 years
Ethnicity
- African American (6%)
- American Indian / Alaska Native (1%)
- Asian (33%)
- Hispanic (26%)
- White (31%)
- Unknown (3%)
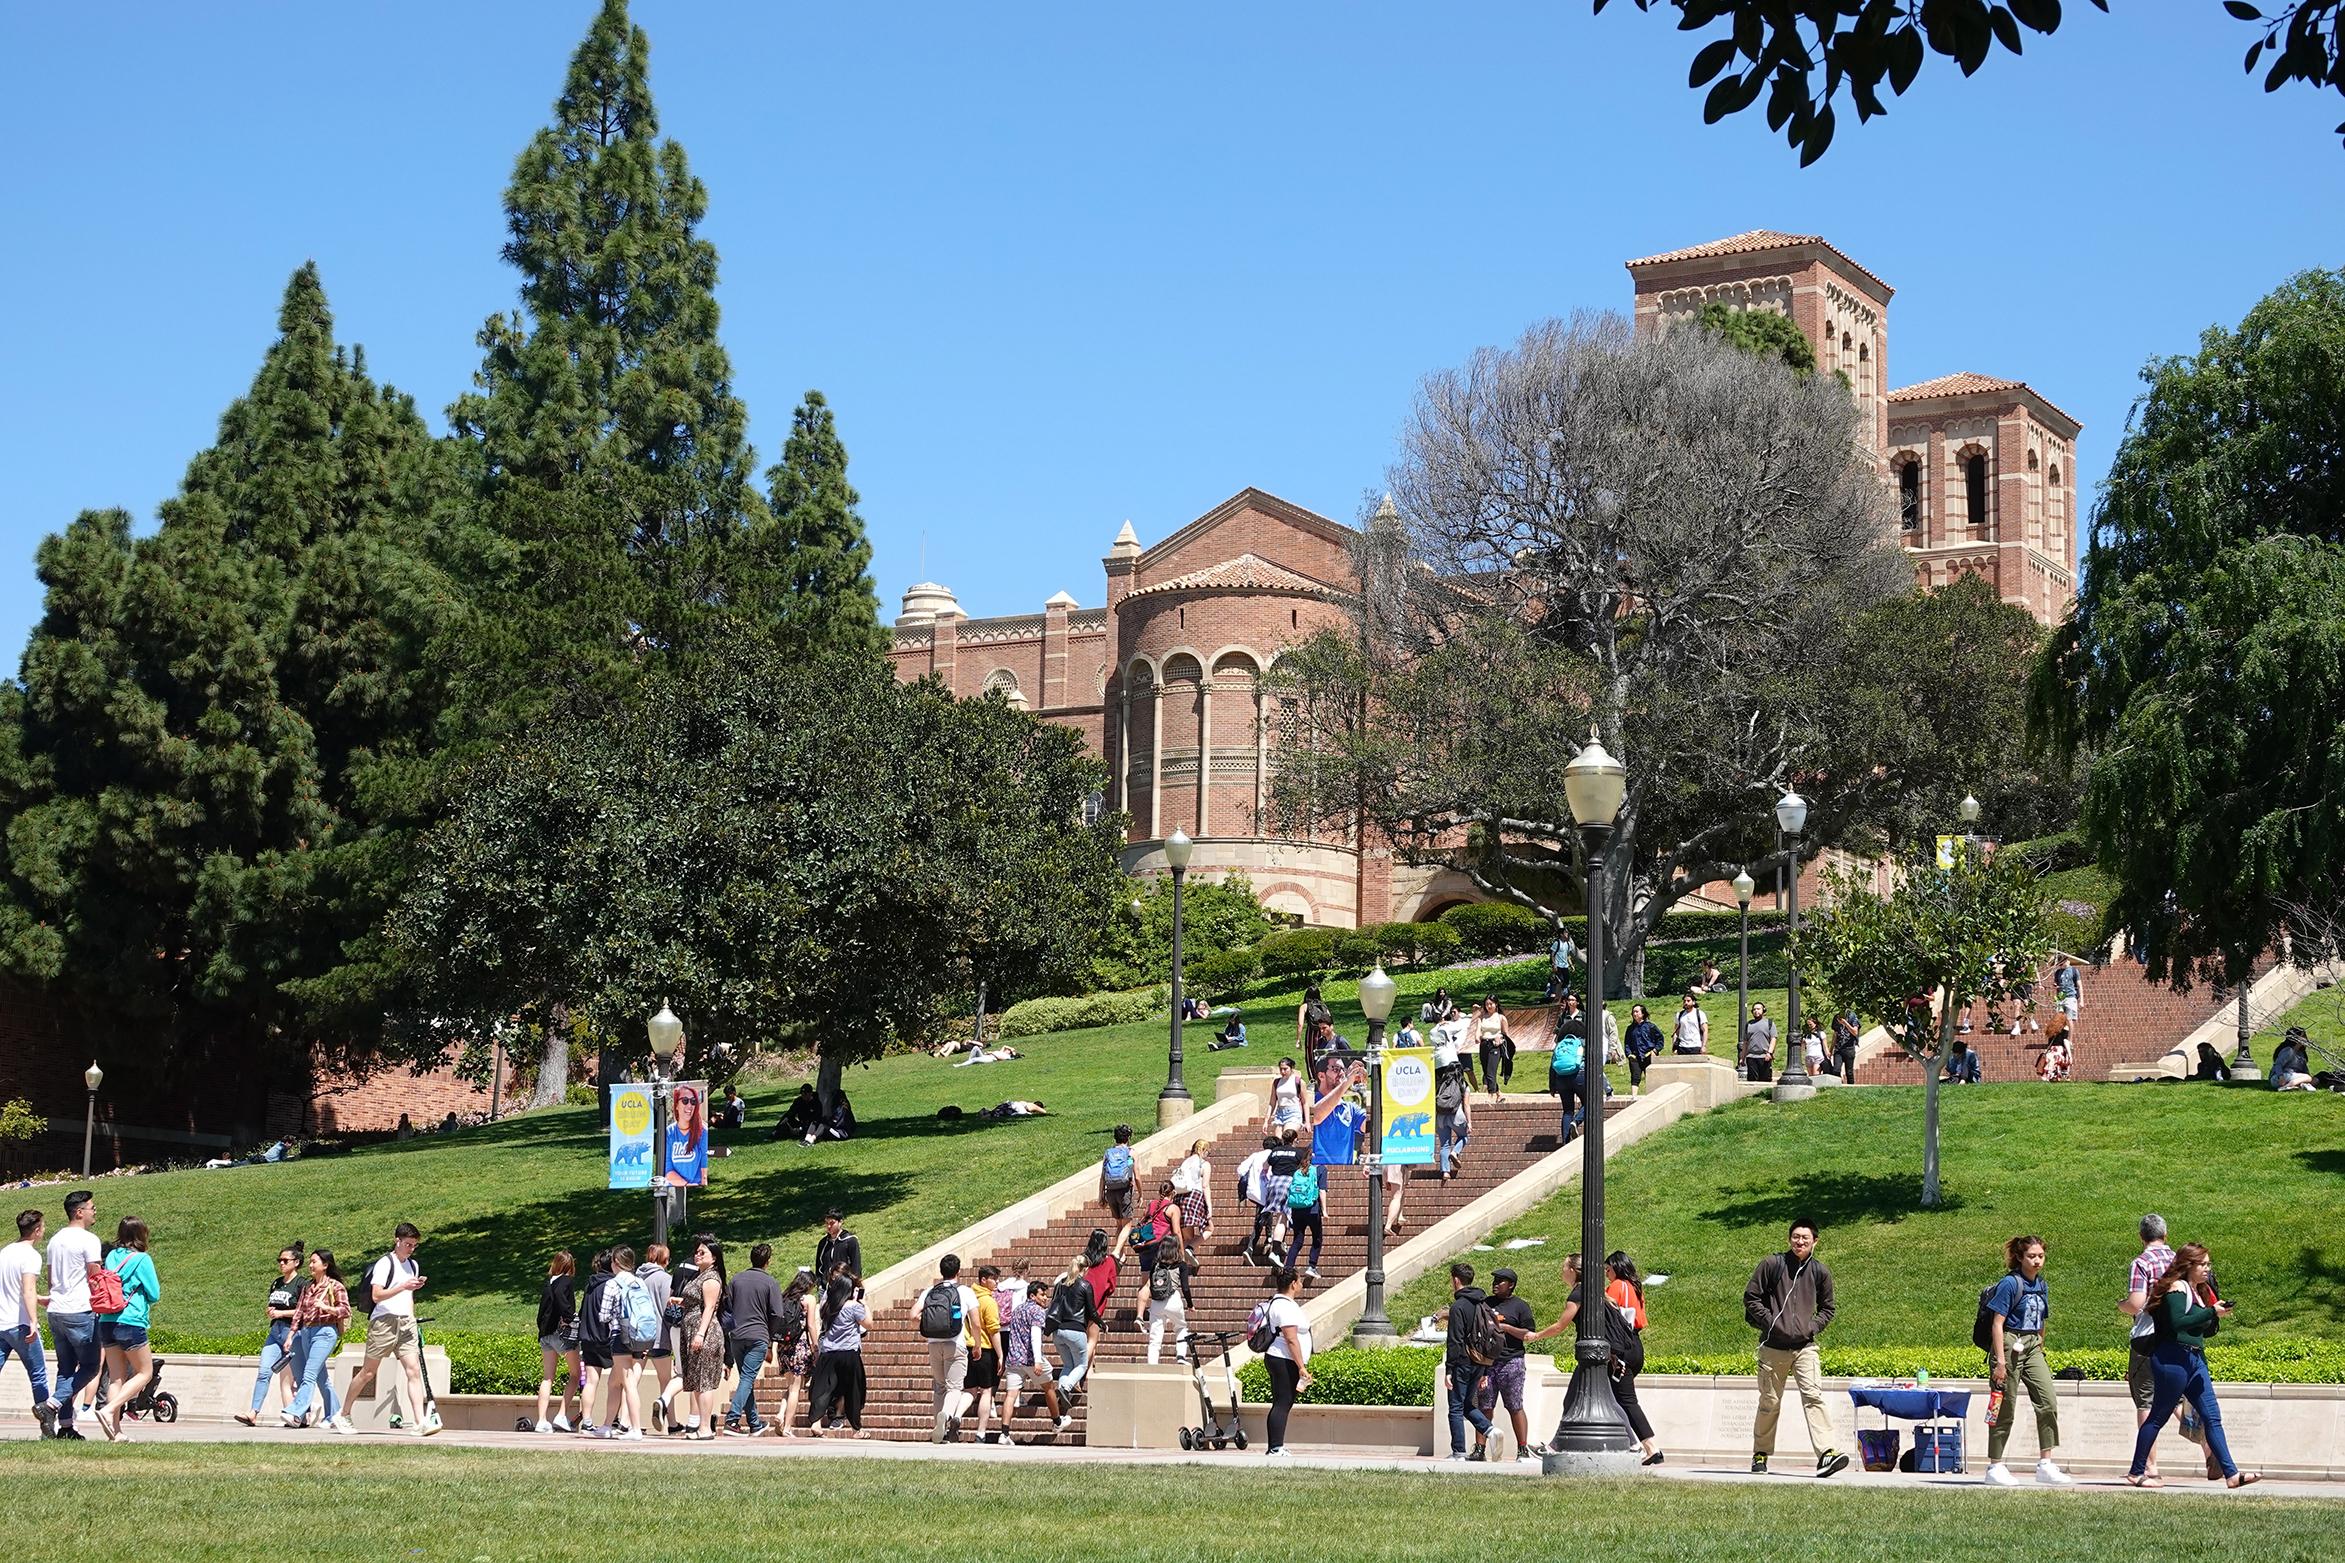
Photo Credit: Patricia Marroquin/UCLA
Top 10 Transfer Majors
1. Sociology
2. Psychology
3. Political Science
4. Economics
5. History
6. English
7. Anthropology
8. Business Economics
9. Biology
10. Philosophy
All data was pulled from UCLA Campus Statistics and UCLA Student Affairs Information and Research Office.